




September 16, 2026

September 18, 2025
September 10, 2025
July 3, 2025
What Is Technical Analysis? Types, Tools and Examples

Author
Shoonya Team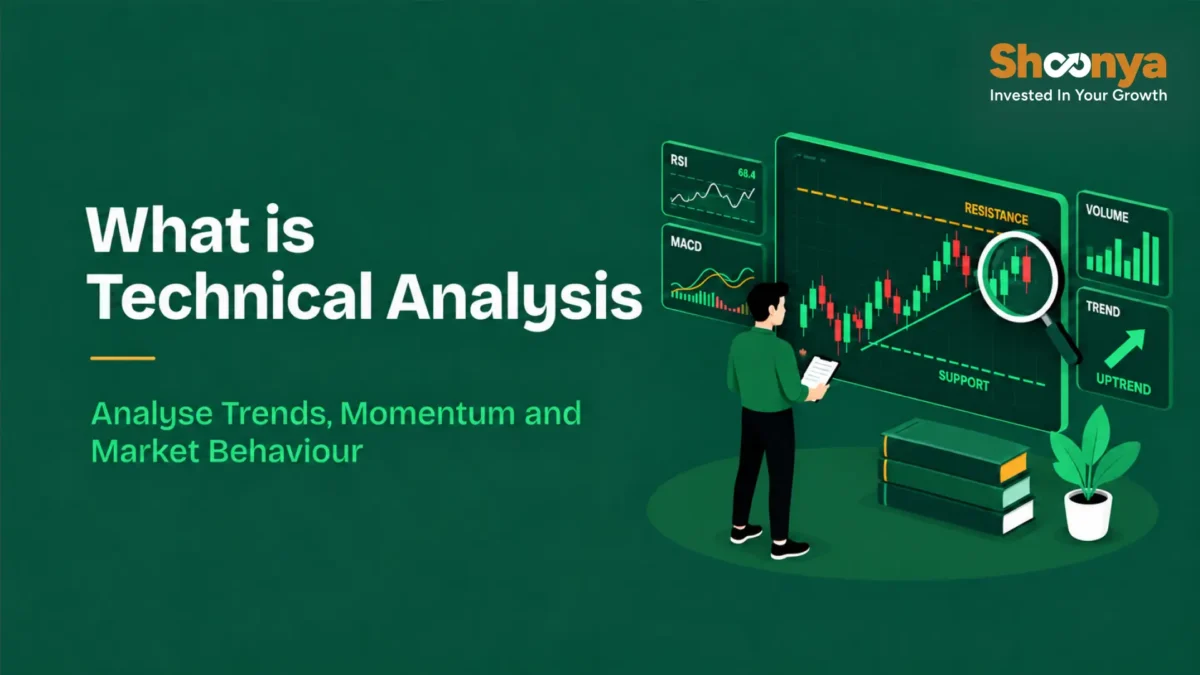
Every stock chart tells who’s buying, who’s selling, and where the tug-of-war between the two is happening right now. Most people look at a chart and just see a line going up or down.
On the other hand, traders look at the same chart and see momentum building, pressure fading, and levels where the crowd has reacted before. That’s what technical analysis does. Reading price and volume history to understand market behaviour, not to predict the future with certainty.
This guide breaks down what technical analysis means, the charts and indicators traders use, and the mistakes beginners should avoid.
What Is Technical Analysis?
Technical analysis is the study of past price, volume, and market behaviour: how price is moving, whether volume backs that move, and how the market has reacted at similar levels before.
It works across:
- Stocks
- Market indices
- Futures and options
- Commodities
- Currencies
- Any instrument with enough historical data
It tends to work best in liquid markets, where high participation keeps prices from being distorted by low trading volumes.
What Are the Basic Assumptions of Technical Analysis?
Technical analysis rests on three core assumptions.
- 1. The market already knows: Public information, expectations, and sentiment are assumed to already be reflected in the price, which is why the focus stays on price and volume rather than digging into every underlying factor.
- 2. Prices tend to move in trends: Once a trend starts, it often continues until price shows signs of weakening or reversing:
- Uptrend: higher highs, higher lows
- Downtrend: lower highs, lower lows
- Sideways trend: price stays within a range
- 3. History tends to repeat: Fear, optimism, and uncertainty show up again and again, often forming recognisable chart patterns. That said, a similar pattern doesn’t guarantee the same outcome every time.
How Does Technical Analysis Work?
It starts with OHLC data, the four numbers every price chart is built on:
- Open: first traded price in the period
- High: highest traded price
- Low: lowest traded price
- Close: final traded price
The “period” can be a minute, an hour, a day, or a month, depending on how long the trader plans to hold the position. From here, traders study a few key things:
- Trend direction: Whether price is generally rising, falling, or range-bound, so trades aren’t placed against the broader move.
- Support and resistance: Support is where buying has previously stepped in to slow a decline; resistance is where selling has previously capped a rally. Both are zones, not exact prices, so a stock crossing a level briefly doesn’t necessarily break the pattern.
- Momentum: How fast and strong a move is, which helps gauge whether a trend is gaining or losing steam.
- Volume: How many shares changed hands. A move backed by high volume usually carries more weight than one on thin volume.
- Entry and exit levels: Technical analysis can help map out an entry point, a target, a stop-loss, and the level at which the whole setup is invalidated. These add structure, but they don’t prevent losses.
Technical Analysis vs Fundamental Analysis: What’s the Difference?
Technical analysis studies price and volume to time the market; fundamental analysis studies the business itself to judge its value.
| Basis | Technical Analysis | Fundamental Analysis |
|---|---|---|
| Main focus | Price, volume, market behaviour | Business performance and valuation |
| Data used | Charts, trends, patterns, indicators | Revenue, profit, cash flow, debt |
| Purpose | Market direction and timing | Business quality and potential value |
| Typical timeframe | Short, medium, or long term | Usually medium to long term |
| Key limitation | Signals can be delayed, subjective, or false | Valuation depends on assumptions |
How Do Traders Read a Chart?
Most chart reviews follow a similar sequence:
- Pick the timeframe that matches your holding period: Minutes for intraday, daily or weekly for positional trades. The same stock can look bullish on one timeframe and bearish on another.
- Spot the broader trend by scanning the sequence of highs and lows before zooming into individual signals.
- Mark key price zones using past swing highs, swing lows, and consolidation areas.
- Check momentum and volume to see if a move is strengthening or fading, and whether enough participation is backing it.
- Wait for confirmation rather than acting the moment price touches a level; a close beyond it, stronger volume, or follow-through in the next session all help confirm a real move.
- Define your risk before entering by deciding upfront when the setup would be invalidated.
What Are the Main Types of Technical Analysis?
Technical analysis is built on two main types of tools: chart formats that show price visually, and price patterns that reveal potential reversals or continuations.
Chart types show the same price data in different formats:
- Line chart: Connects closing prices; clean but doesn’t show the full trading range
- Bar chart: Shows open, high, low, and close for each period
- Candlestick chart: Displays OHLC data as a body and wicks, making it easy to see the relationship between open and close; this is the most widely used format.
- Point and figure chart: Uses columns of Xs and Os to track significant price changes, filtering out time and minor moves.
Chart patterns are shapes formed by price movement that traders use to judge whether a move is likely to continue or reverse: triangles, flags, double tops, double bottoms, head and shoulders, and rounding bottoms. A pattern isn’t considered valid until it meets its confirmation conditions.
What Are the Main Categories of Technical Indicators?
Indicators are mathematical calculations built on price, volume, or both, each answering a different question.
| Category | What It Measures | Common Examples |
|---|---|---|
| Trend | Overall market direction | Moving averages, MACD |
| Momentum | Speed and strength of a move | RSI, Rate of Change |
| Volume | Participation behind a move | Volume bars, OBV |
| Volatility | How much price is fluctuating | Bollinger Bands, ATR |
| Breadth | Participation across a market/index | Advance-Decline Line |
Here are the commonly used technical indicators:
- Moving averages smooth out short-term noise by averaging price over a set number of periods. Shorter averages react faster but produce more noise; longer averages move slower and confirm trends later. A crossover, one average crossing another, can hint at improving momentum, though it doesn’t guarantee the move continues.
- RSI (Relative Strength Index) measures momentum on a 0–100 scale. Above 70 is generally read as overbought, below 30 as oversold, but RSI can stay elevated through a strong uptrend, so an overbought reading alone isn’t a sell signal.
- MACD (Moving Average Convergence Divergence) tracks the relationship between two exponential moving averages. Traders watch MACD-signal line crossovers, movement above or below the zero line, and divergence from price. Since it’s based on past prices, it can react after a move has already started.
- Bollinger Bands combine a moving average with two volatility-based bands. Expanding bands suggest rising volatility; contracting bands suggest price is compressing. Touching a band on its own isn’t a buy or sell signal.
- ATR (Average True Range) measures volatility, not direction, helping traders size stop-losses based on how much a stock typically moves.
- OBV (On-Balance Volume) combines price direction and volume to gauge buying or selling pressure. When price and OBV disagree, it’s worth checking whether real participation is backing the trend.
Which Trading Styles Use Technical Analysis?
| Trading Style | Typical Holding Period | Common Chart Focus |
|---|---|---|
| Scalping | Seconds to minutes | Tick or very short intraday charts |
| Intraday trading | Within the same session | Minute charts with daily context |
| Swing trading | Days to a few weeks | Hourly, daily, weekly charts |
| Positional trading | Weeks to months+ | Daily, weekly, monthly charts |
What Are the Advantages of Technical Analysis?
Technical analysis provides a structured way to interpret price behaviour, assess market conditions and plan decisions using observable data.
- Structure over emotion: Charts help traders follow predefined rules instead of reacting impulsively
- Clear entry and exit planning: Technical levels map out entries, targets, and stop-losses
- Works across timeframes: The same principles apply intraday, daily, weekly, or monthly
- Reflects real-time behaviour: Price and volume respond continuously to shifting demand and sentiment
- Pairs well with other research: Combines easily with fundamental, quantitative, or macro analysis
What Are the Limitations of Technical Analysis?
Technical analysis cannot predict outcomes with certainty, as signals may be delayed, subjective or affected by changing market conditions.
- Signals can fail: Breakouts reverse, patterns stay incomplete, crossovers give false reads
- Interpretation is subjective: Two traders can draw different trend lines on the same chart
- Indicators lag: Most are built on historical data, so they often confirm a move after it’s already happened
- Conditions shift: An indicator that worked in a trending market may behave differently in a range-bound one
- It ignores business quality: Technical analysis says nothing about revenue, debt, or management, factors that still matter over the long run
What Mistakes Should Beginners Avoid?
Beginners often struggle when they rely on too many indicators, ignore the wider market context or act without a defined risk-management plan.
- Overloading the chart: Too many indicators create clutter and conflicting signals, especially when they measure similar things
- Ignoring the bigger trend: A bullish signal on a short-term chart can sit inside a larger downtrend
- Treating zones as exact numbers: Support and resistance are ranges, not precise prices
- Jumping in before confirmation: Anticipating a breakout early risks getting caught in a false move
- Skipping the stop-loss: Every setup can fail, so define your exit before you enter, not after
- Changing the plan mid-trade: Shifting a stop-loss or target without a clear reason turns a structured setup into a gut call
- Forgetting trading costs: Brokerage, taxes, and slippage eat into returns, especially for frequent trades
- Treating patterns as guarantees: Past behaviour offers context, not certainty
How Can Beginners Start Learning Technical Analysis?
Beginners can start by understanding basic chart concepts, practising with simple tools and reviewing their observations before using real capital.
- Learn OHLC data, candlesticks, and chart timeframes
- Understand trends, support, resistance, and volume
- Start with one trend indicator plus one confirmation tool
- Study charts across different market conditions
- Define entry, target, stop-loss, and invalidation levels
- Practice on historical charts or a simulated environment
- Record every setup and review the outcome
- Factor in transaction costs when assessing performance
Key Takeaways
- Technical analysis studies historical price, volume, and market behaviour
- It helps identify trends, momentum, and key price zones
- Signals indicate probability, not certainty
- Support and resistance work best when treated as zones, not fixed numbers
- More indicators don’t automatically mean better analysis
- Risk management and position sizing stay essential regardless of the setup
- It works well alongside fundamental research, not as a replacement for it
Technical Analysis of Stocks : FAQs
Is technical analysis only for intraday trading?
No, it applies to intraday, swing, and positional trading alike; the chart timeframe just needs to match the intended holding period.
Which chart is most commonly used?
Candlestick charts, since they display open, high, low, and close in a format that’s easy to read at a glance.
Which technical indicator is the best?
Moving averages, RSI, MACD, Bollinger Bands, and ATR each measure a different aspect of price behaviour.
What are support and resistance?
Support is a zone where buying has previously slowed a decline; resistance is a zone where selling has previously capped a rally.
What’s the difference between technical and fundamental analysis?
Technical analysis studies price and volume behaviour; fundamental analysis evaluates a company’s financial performance and valuation.


Explore Our Offerings

Stocks
Trade equities across NSE and BSE with zero delivery charges. Invest, hold or sell with a seamless experience.


Future & Options
Execute complex strategies with simple tools and real-time data.

IPOs
Apply to the latest IPOs in just a few taps. Stay updated and capture opportunities as they open.