


September 16, 2026

September 18, 2025
September 10, 2025
July 3, 2025
Chart Patterns in Trading: Understand Types, Entry, Stop-Loss & Target Levels

Author
Shoonya Team
A price chart can look like a collection of random candles until you begin noticing how often prices form recognisable structures around support, resistance and trends.
These structures are known as chart patterns. Traders use them in technical analysis to study price behaviour and identify possible entry and exit levels. However, it is probability-based rather than predictive, so a recognised pattern does not guarantee the next price move.
This blog explains common chart patterns, including reversal and continuation formations, along with the conventional entry, stop-loss, and measured-target logic associated with each.
What Are Chart Patterns in Trading?
Chart patterns are recognisable formations created by price movements over time. Traders study these formations to understand the interaction between buying and selling pressure and to identify levels where the existing trend could continue or change direction.
Technical analysis is based on the idea that prices move in observable trends and that recurring market behaviour can create recognisable patterns. A trend itself is identified through peaks and troughs:
- Higher highs and higher lows characterise an uptrend
- Lower highs and lower lows characterise a downtrend
Chart patterns are commonly grouped into two broad categories:
| Pattern category | What it indicates | Common examples |
|---|---|---|
| Reversal patterns | A possible change in the existing trend | Head and Shoulders, Double Top, Double Bottom |
| Continuation patterns | A possible resumption of the preceding trend after consolidation | Triangles, Flags, Cup and Handle |
Which are Reversal Chart Patterns?
Reversal patterns develop around an existing trend and suggest the balance between buyers and sellers may be shifting. Traders generally interpret them only after the relevant support or resistance level breaks.
Here are six widely recognised reversal formations.
1. Head and Shoulders Pattern
Bearish reversal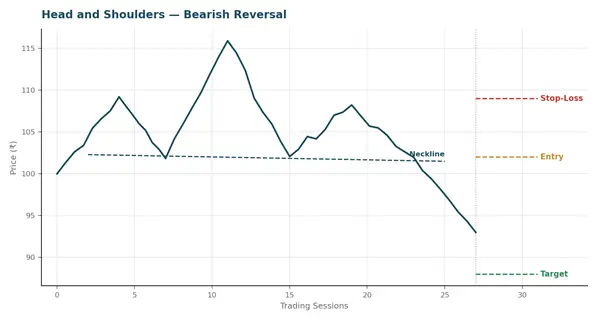
A head and shoulders formation generally develops after an uptrend. It contains three peaks: a left shoulder, a higher central peak called the head, and a right shoulder. The troughs between these peaks form the neckline.
The structure suggests that although buyers pushed the price to a new high at the head, they could not reproduce that strength during the right shoulder.
- Entry: A conventional bearish trigger is a closing break below the neckline. Some traders instead watch for price to retest the broken neckline.
- Stop-loss: Place a technical invalidation level above the right shoulder.
- Target: Measure the vertical distance between the head and neckline, then project that distance downward from the breakout level.
The measured move is an estimate, not an assured price objective.
2. Inverse Head and Shoulders Pattern
Bullish reversal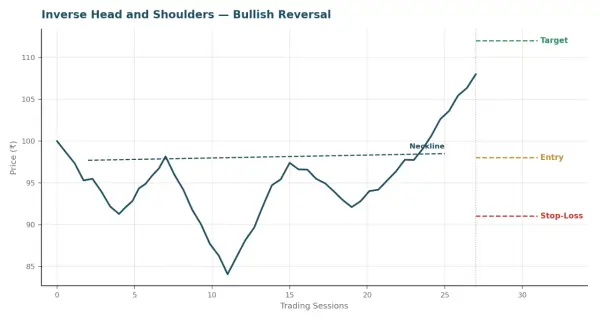
An inverse head and shoulders is the opposite structure. It generally develops after a downtrend and consists of three troughs: the middle trough, or head, is lower than the two shoulders.
Resistance connecting the peaks between these troughs creates the neckline.
- Entry: A conventional bullish trigger occurs when price closes above the neckline.
- Stop-loss: The right shoulder low can serve as a technical invalidation reference.
- Target: Measure the vertical distance from the head to the neckline, then project it upward from the breakout.
The important distinction is confirmation: the three-trough shape alone does not constitute a completed breakout.
3. Double Top Pattern
Bearish reversal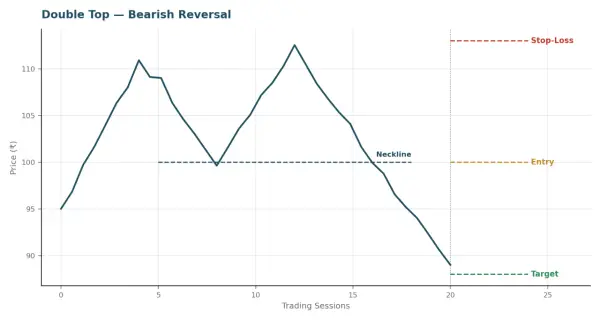
A double top resembles an M and generally appears after an upward move. Price reaches a high, retreats, returns to approximately the same resistance zone and fails to move sustainably higher.
The low between the two peaks becomes the neckline or confirmation level.
- Entry: A close below the neckline is commonly treated as confirmation.
- Stop-loss: Use a level above the second peak as the invalidation point.
- Target: Measure the distance between the peaks and the neckline, then project it downward from the breakdown.
The second peak by itself is not necessarily confirmation because price may remain range-bound instead of reversing.
4. Double Bottom Pattern
Bullish reversal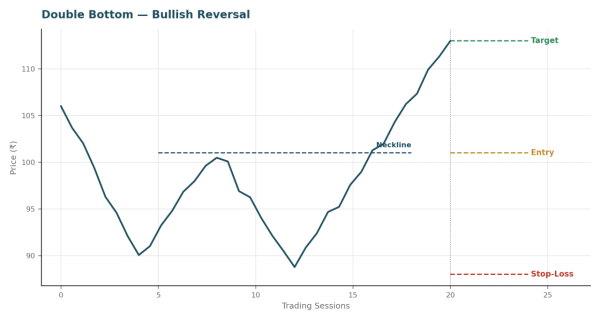
A double bottom resembles a W and generally forms after a decline. Price creates one low, rebounds and subsequently tests approximately the same support region without establishing a sustained lower low.
The high between the two troughs acts as the neckline.
- Entry: A closing break above the neckline is the conventional confirmation signal.
- Stop-loss: The area below the second trough can act as the technical invalidation level.
- Target: Measure the distance from the trough area to the neckline and project it upwards from the breakout.
As with a double top, confirmation matters because two similar lows alone do not confirm a reversal.
5. Rising Wedge Pattern
Commonly bearish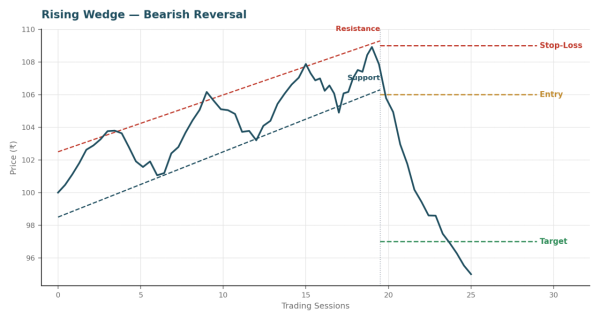
A rising wedge contains two upward-sloping trendlines that gradually converge. Price continues making higher highs and higher lows, but the trading range becomes narrower.
This compression can indicate weakening upward momentum.
- Entry: A close below the lower rising trendline is commonly watched as a bearish trigger.
- Stop-loss: The latest relevant swing high or upper boundary can provide an invalidation reference.
- Target: One conventional approach watches for price to move towards the wider base area from which the wedge developed.
Context remains important because wedges can behave differently depending on the preceding trend and market conditions.
6. Falling Wedge Pattern
Commonly bullish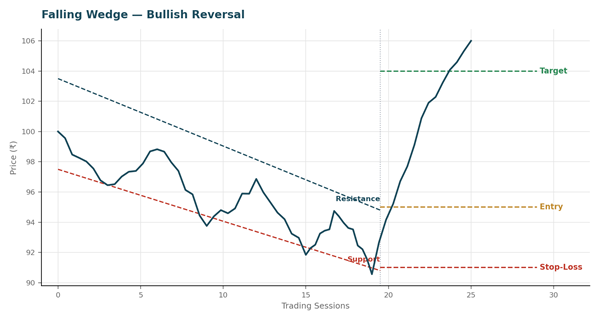
A falling wedge consists of two downward-sloping, converging trendlines. Price continues to decline within the structure, but its range progressively contracts.
- Entry: Traders typically watch for a closing breakout above the upper descending trendline.
- Stop-loss: The latest relevant swing low can serve as an invalidation reference.
- Target: The wider upper area near the beginning of the formation can provide one technical reference for the measured move.
Traders should still evaluate a breakout alongside broader price action rather than treating it as an isolated signal.
Which are Continuation Chart Patterns?
Continuation patterns represent periods in which an established trend pauses or consolidates. If price subsequently breaks in the direction of the earlier trend, traders may interpret the formation as continuation.
Common traditional chart formations include symmetrical, ascending, and descending triangles, flags, and cup-and-handle structures.
7. Ascending Triangle Pattern
Commonly bullish continuation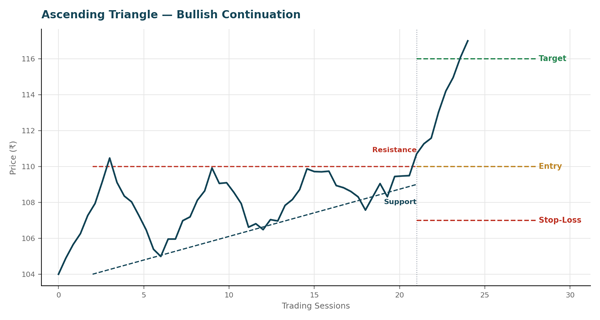
An ascending triangle combines horizontal resistance with a rising support line. Price repeatedly hits about the same ceiling while successive lows rise.
This structure reflects increasing buying pressure against a defined resistance area.
- Entry: A close above horizontal resistance is commonly used as confirmation.
- Stop-loss: A level below the latest higher low or rising support line can provide an invalidation reference.
- Target: Measure the triangle at its widest point and project that height upwards from the breakout.
A breakout can still fail, so don’t treat the projected level as a guaranteed outcome.
8. Descending Triangle Pattern
Commonly bearish continuation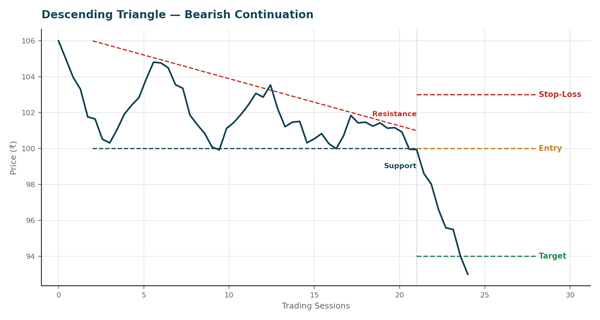
A descending triangle is effectively the opposite structure. It contains relatively flat support and a series of lower highs.
Repeated tests of the same support area combined with falling highs indicate increasing selling pressure.
- Entry: A closing break below horizontal support is commonly watched as confirmation.
- Stop-loss: The latest lower high or upper trendline can provide a reference for invalidation.
- Target: Measure the widest part of the triangle and project that distance downwards from the breakdown.
9. Symmetrical Triangle Pattern
Continuation, direction dependent on breakout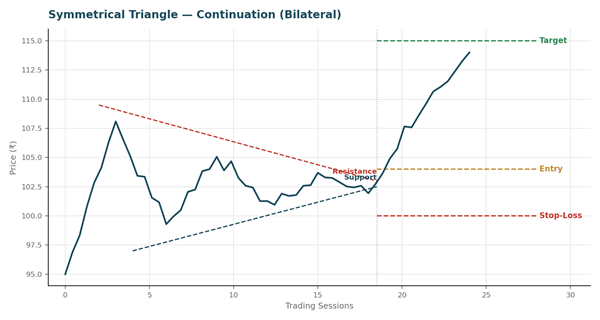
A symmetrical triangle develops when lower highs and higher lows cause both trendlines to converge.
Unlike ascending and descending triangles, neither side remains horizontal. The pattern itself therefore does not require traders to assume a direction before the breakout occurs, since either boundary can eventually give way.
- Entry: A close beyond either converging trendline is generally treated as the signal. The direction of the breakout, rather than the pattern’s appearance, determines whether the setup is read as bullish or bearish.
- Stop-loss: A level on the opposite side of the breakout, near the most recent swing point inside the triangle, can serve as an invalidation reference.
- Target: The vertical distance at the triangle’s widest section is typically measured and projected from the breakout point in the direction price broke.
Because a symmetrical triangle can resolve either way, many traders wait for the close beyond a trendline rather than anticipating the direction in advance.
10. Bull Flag Pattern
Bullish continuation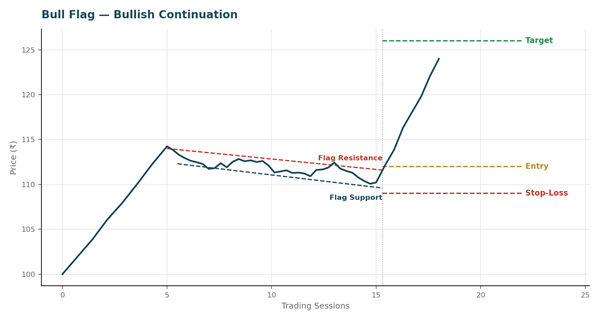
A bull flag typically forms after a sharp upward move, known as the flagpole. Price then consolidates within a short, downward-sloping parallel channel as the earlier momentum pauses.
The contained, gently sloping pullback distinguishes a flag from a deeper reversal.
- Entry: A close above the upper boundary of the flag’s channel is commonly used as the continuation trigger.
- Stop-loss: A level below the lower boundary of the flag, or below the most recent swing low within the consolidation, can act as the invalidation point.
- Target: Measure the flagpole length and project it upward from the breakout point.
A flag that stretches on for an extended period or retraces deeply into the flagpole is generally viewed with more caution.
11. Bear Flag Pattern
Bearish continuation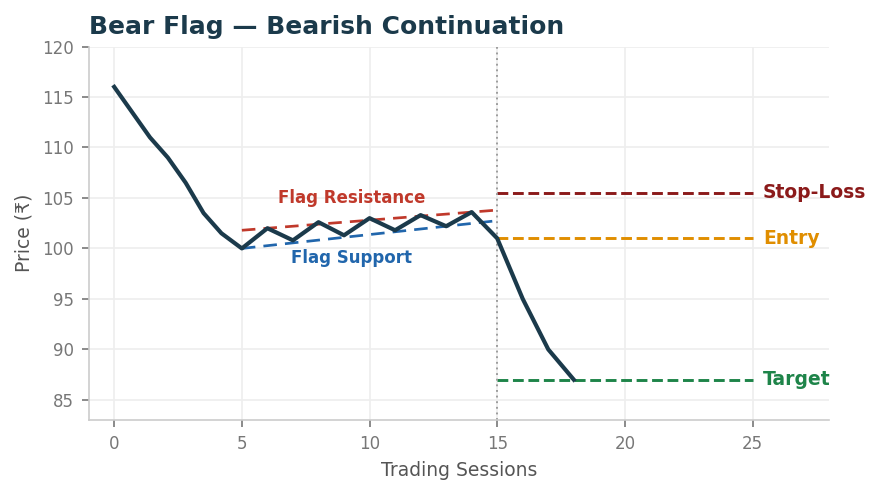
A bear flag mirrors the bull flag. It follows a sharp decline, after which price consolidates within a short, upward-sloping parallel channel before the prior downward move potentially resumes.
- Entry: A close below the lower boundary of the flag’s channel is the conventional bearish trigger.
- Stop-loss: A level above the upper boundary of the flag can provide a technical invalidation reference.
- Target: The length of the preceding flagpole is measured and projected downwards from the breakdown point.
As with its bullish counterpart, the reliability of a bear flag is often considered alongside the volume and speed of the original decline.
12. Cup and Handle Pattern
Bullish continuation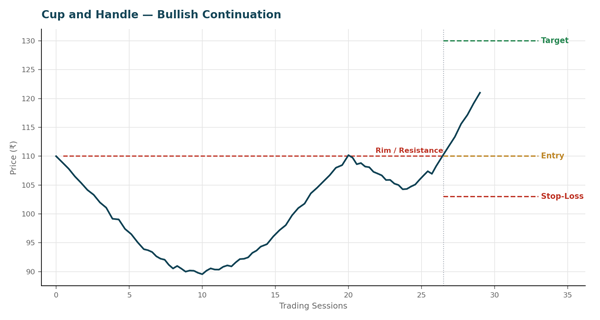
A cup and handle generally forms after an uptrend. Price first declines and gradually rounds back upward, creating a “cup” shaped like a U rather than a sharp V. Once price approaches its earlier high, a smaller, shallow pullback known as the “handle” typically forms before any further advance.
The rounded base often signals a gradual shift from selling to buying pressure, while the handle reflects a brief pause near resistance.
- Entry: A close above the resistance level formed by the cup’s rim, or above the handle’s upper boundary, is commonly treated as confirmation.
- Stop-loss: A level below the handle’s low can serve as an invalidation reference.
- Target: The depth of the cup, measured from its rim to its lowest point, is typically projected upwards from the breakout level.
A handle that retraces too deeply into the cup, or takes an unusually long time to form, is often viewed as weakening the setup.
How Traders Commonly Approach Chart Patterns
A pattern’s shape alone is rarely enough. Traders commonly consider a few additional factors alongside pattern recognition.
- Volume: A breakout or breakdown with comparatively higher trading volume often carries more weight than one on weak volume, since volume can reflect the degree of participation behind a move.
- Confirmation: Many traders wait for a closing price beyond the relevant level rather than acting on an intraday breach, since price can briefly pierce a level and reverse.
- Broader market context: A pattern forming within a strong prevailing trend, alongside relevant support and resistance zones, or near a significant news event, may behave differently than the same pattern in isolation.
- Risk management: Because no pattern completes successfully every time, traders generally consider position sizing and a predefined stop-loss alongside the pattern, rather than relying on the formation in isolation.
What Are the Limitations of Chart Patterns?
Chart patterns are a tool for studying probability, not a guarantee of future price movement. A few limitations are worth keeping in mind.
- False breakouts: Price can briefly move beyond a level and then reverse back into the pattern, a move commonly referred to as a “false breakout.”
- Similar formations, different outcomes: Two patterns can look alike on the chart yet resolve differently, since market conditions, volume and the broader trend all influence the result.
- Subjective interpretation: Necklines, trendlines and boundaries are not always drawn identically by different traders, so the same chart can be read in slightly different ways.
- Not a standalone signal: A pattern is generally considered more informative when read alongside volume, confirmation and other forms of analysis rather than in isolation.
- No guaranteed target: Measured targets are technical estimates, not assured price levels, and price may fall short of or move well beyond the projected level.
End Note
None of these patterns functions as a guaranteed signal. They work best as part of a broader technical analysis process, considered alongside volume, confirmation, and sound risk management, rather than as a standalone method for making trading decisions.
Chart Patterns : FAQs
Are chart patterns a reliable way to predict price movements?
Chart patterns are probability-based tools, not predictive ones. They can highlight areas where buying or selling pressure may shift, but a recognised pattern does not assure that price will move as expected.
What is the difference between a reversal pattern and a continuation pattern?
A reversal pattern suggests the existing trend could be changing direction, while a continuation pattern suggests a prevailing trend could resume after a period of consolidation.
Why do traders wait for a “close” beyond a level rather than acting immediately?
Price can briefly move beyond support, resistance, or a trendline intraday and then reverse. Waiting for a closing price beyond the level is one conventional way traders try to reduce the impact of such false moves, though it does not eliminate the possibility of a delayed reversal.
Is a stop-loss necessary when trading chart patterns?
Since no pattern resolves successfully every time, a predefined stop-loss is commonly used as part of risk management when trading around chart patterns.
Can chart patterns be used across different timeframes?
Chart patterns are studied across multiple timeframes, from intraday charts to weekly or monthly charts. The formation’s significance is often considered relative to the timeframe on which it appears.


Explore Our Offerings

Stocks
Trade equities across NSE and BSE with zero delivery charges. Invest, hold or sell with a seamless experience.


Future & Options
Execute complex strategies with simple tools and real-time data.

IPOs
Apply to the latest IPOs in just a few taps. Stay updated and capture opportunities as they open.