


September 16, 2026

September 18, 2025
September 10, 2025
July 3, 2025
Technical vs Fundamental Analysis: Which Fits Your Approach?

Author
Shoonya Team
The same stock can appear undervalued in its financial statements and weak on its price chart. Which signal should an investor follow?
The answer depends on the decision being made. Fundamental analysis examines the business and its estimated value, while technical analysis studies market behaviour to assess timing. This blog compares their data, tools, time horizons, strengths and limitations, with an example showing why the two methods can reach different conclusions.
What Is Fundamental Analysis?
Fundamental analysis (FA) evaluates a company’s financial health and business quality to estimate its intrinsic value. It uses financial statements, earnings reports, management commentary, competitive positioning and macroeconomic conditions, then compares the estimate with the current market price.
Common fundamental analysis tools include:
- Price-to-earnings (P/E)
- Price-to-book (P/B) ratios
- Return on equity (ROE)
- Earnings growth
- Debt-to-equity
- Free cash flow
- Discounted cash flow (DCF) modelling
Analysts typically work top-down, economy, then sector, then company or bottom-up, starting from a company they find interesting and working outward to see if the broader environment supports it.
What Is Technical Analysis?
Technical analysis (TA) studies historical price and volume data to assess a stock’s possible near-term direction. It assumes that available information is reflected in the price, movements can form trends, and market psychology may produce recurring patterns.
Analysts use charts, candlesticks, trend lines, support, resistance and indicators such as moving averages, RSI and MACD to plan entries and exits.
Unlike fundamental analysis, technical analysis makes no judgment about whether a business is good or bad; a technically strong setup can appear on a company with weak financials, and a fundamentally excellent company can look technically weak for months at a time.
What is the Difference Between Fundamental and Technical Analysis?
A side-by-side comparison shows how the two methods differ. One begins with the business; the other begins with market activity.
| Aspect | Fundamental Analysis | Technical Analysis |
|---|---|---|
| Objective | Estimate a stock’s intrinsic value and decide whether to own it. | Read price and volume patterns to time entries and exits. |
| Data used | Financial statements, earnings, management commentary, industry and macro data. | Historical price, volume, and chart patterns. |
| Time horizon | Typically months to years suited to investors. | Typically minutes to weeks suited to traders. |
| Core question | “Is this a good business at this price?” | “Is this the right time to buy or sell?” |
| Key tools | P/E, P/B, ROE, EPS growth, DCF valuation, balance sheet ratios. | Moving averages, RSI, MACD, support/resistance, chart patterns. |
| Underlying belief | Price eventually converges to intrinsic value. | Price reflects all known information and moves in trends that tend to repeat. |
| Best suited for | Longterm investors, portfolio building, buy and hold strategies. | Traders, swing and intraday strategies, timing entries/exits. |
Example: When Fundamentals and Technicals Disagree
The real-world value of understanding both approaches shows up when they point in different directions. The chart below illustrates a common scenario: a stock whose fundamental analysis suggests it is worth ₹100 to 108 (its “fair value band”), but whose price falls well below that range during a period of negative sentiment, before a technical trend reversal later confirms it’s a good time to act on that fundamental view.
Simulated price data illustrating fundamental fair value vs. technical entry timing.
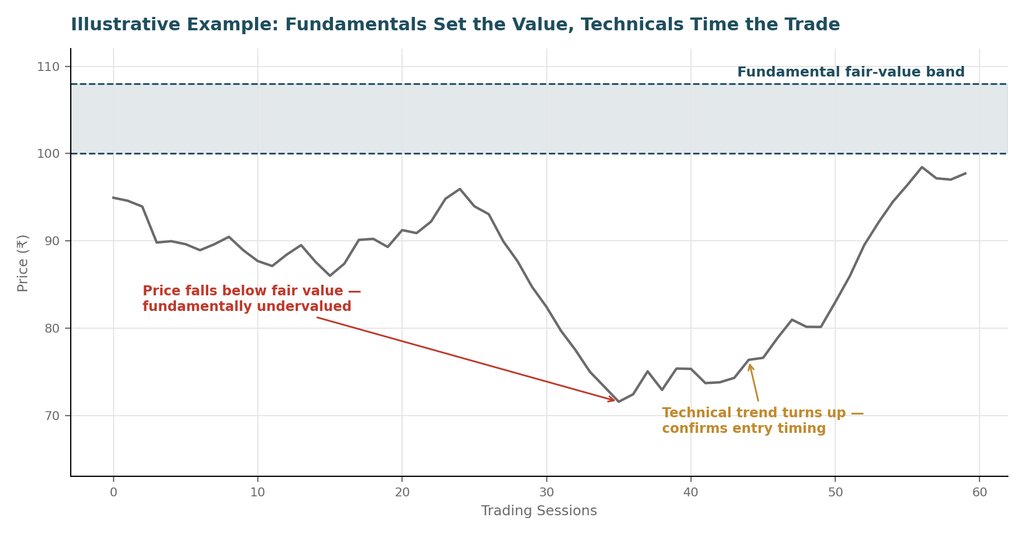
A pure fundamental investor might have bought as soon as the price dropped below ₹100, reasoning the stock was already cheap, and then watched it fall further for several weeks. A pure technical trader might have ignored the stock entirely on the way down, since the trend was clearly bearish, and only grown interested once a reversal appeared. An investor using both tools gets the best of each: fundamentals to confirm the stock is worth buying at all, and technicals to avoid catching a falling knife by waiting for the trend to actually turn.
The example highlights their distinct roles: one assesses whether the stock may be worth owning, while the other helps evaluate when to act. The comparison below brings the main differences together.
What are the Pros and Cons of Fundamental Analysis?
Fundamental analysis is the backbone of long-term investing, but it comes with limitations traders should weigh honestly:
| Pros | Cons |
|---|---|
| Grounded in a company’s real financial health: earnings, cash flow, debt, and competitive position. | Time-consuming: reading annual reports, filings, and industry data takes far longer than reading a chart. |
| Suited to long-term investing; helps identify quality businesses to hold through short-term noise. | Slow to reflect new information; a stock can stay mispriced for quarters before the market rerates it. |
| Provides a defensible estimate of intrinsic value, useful for judging whether a price is low or expensive. | Valuation involves assumptions and judgment; two analysts modelling the same company can reach different fair values. |
| Works well even without an entry timing edge, since the investment thesis plays out over years. | Offers little guidance on when to buy or sell; a stock can stay undervalued far longer than expected. |
| Less prone to short-term noise, since the focus is on the underlying business rather than daily price swings. | Not designed for intraday or short-term trading, where price moves faster than fundamentals change. |
What are the Pros and Cons of Technical Analysis?
Technical analysis is the tool of choice for traders focused on timing, but it has its own well-known limitations:
| Pros | Cons |
|---|---|
| Works in real time, supporting short-term trading and precise entry and exit timing. | Signals are open to interpretation; two analysts can read the same chart differently. |
| Applies across asset classes, including equities, F&O, commodities, currencies, and crypto. | Past patterns do not guarantee future repetition; false signals are common in choppy markets. |
| Helps define stop-loss and target levels, supporting disciplined risk management. | Ignores a company’s financial health, so it can misread the underlying business’s value. |
| Grounded in price and volume data, offering an objective, chart-based approach. | Widely followed indicators can trigger herd behaviour that distorts short-term price action. |
| Visual and pattern-based, making it relatively quick to learn and apply. | Effectiveness depends on skill and experience; new traders often misuse or over-rely on indicators. |
Technical analysis is strong at answering “when,” but it offers no opinion on whether the underlying business deserves your capital in the first place.
Which One Should You Use?
Neither approach is objectively superior; they answer different questions, which is why professional research and trading desks rarely rely on just one. A practical way to combine them:
- For long term investing: let fundamentals decide what to buy and how much it’s worth, then use basic technicals (trend direction, a key support level) to avoid buying into a sharp downtrend.
- For short term trading: let technicals decide when to enter and exit, but use a quick fundamental screen (no major red flags in debt, earnings, or governance) to avoid trading a structurally broken company purely because its chart looks good.
Conclusion
Fundamental and technical analysis examine different parts of the same decision. Long-term investors may place greater weight on business quality and valuation, while shorter-term participants often focus more on price behaviour. Together, the methods can link security selection with timing without implying certainty.
Fundamental vs Technical Analysis : FAQs
What is the main difference between fundamental and technical analysis?
Fundamental analysis evaluates a company’s financial position, business quality and estimated value. Technical analysis studies price, volume and market behaviour to assess possible timing.
Which method is suitable for long-term investing?
Fundamental analysis is generally more relevant for long term investing because it examines business performance and valuation. Technical tools can provide additional context on price behaviour.
Is technical analysis useful for investors?
Yes, investors may use trends, support and resistance to understand current market conditions, even when their main decision is based on company fundamentals.
Can fundamental and technical analysis be used together?
Yes. Fundamentals can help assess what may be worth owning, while technicals can help evaluate when market conditions support an entry or exit.
Does either method guarantee accurate results?
No, valuation assumptions can prove incorrect, and chart signals can fail. Both methods require independent research and risk management.
Which analysis is more suitable for short-term trading?
Technical analysis is commonly used for short term decisions because price and volume change continuously, while company fundamentals usually develop over longer periods.


Explore Our Offerings

Stocks
Trade equities across NSE and BSE with zero delivery charges. Invest, hold or sell with a seamless experience.


Future & Options
Execute complex strategies with simple tools and real-time data.

IPOs
Apply to the latest IPOs in just a few taps. Stay updated and capture opportunities as they open.