


September 16, 2026

September 18, 2025
September 10, 2025
July 3, 2025
What Slowed India’s Industrial Production Growth in September 2026

Author
Shoonya Team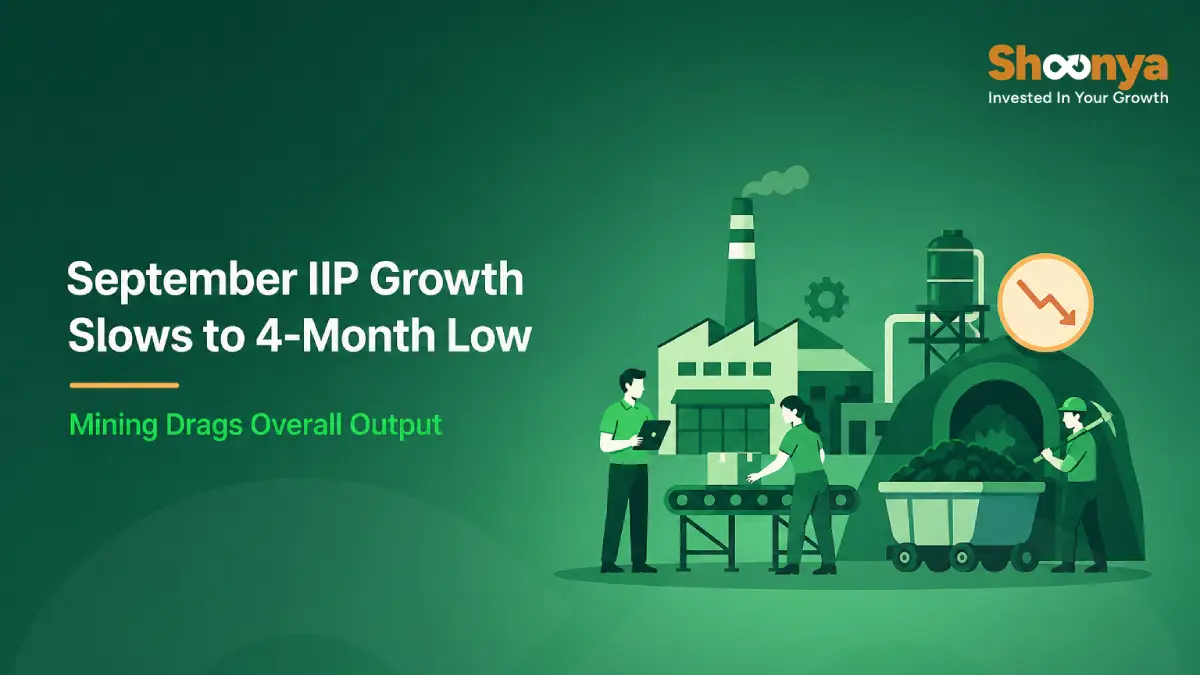
The Ministry of Statistics and Programme Implementation released data on Wednesday showing that the Index of Industrial Production (IIP) grew 6.7% year on year in September. This was the slowest pace in four months. The ministry also revised August’s growth to 7.8% from its provisional estimate of 8%.
Compared with August, the index rose 1%, its biggest month-on-month gain in three months. This suggests that an unfavourable base effect pulled down the annual figure.
How Did Each Sector Perform?
| Sector | September Growth | August Growth | Note |
|---|---|---|---|
| Manufacturing | 7.6% | Not specified | Weight of 76% in the new series; slowest in four months |
| Mining and quarrying | Contraction of 6.2% | Not specified | Steepest fall since September 2023 |
| Electricity and gas supply | 11.2% | 12.3% | August was a 27-month high |
Mining has contracted in eight of the nine months of 2026 so far, making it the main drag on the headline number.
Which Manufacturing Segments Drove or Weakened Growth?
Only 10 of the 23 manufacturing sub-sectors did better than in August. Madan Sabnavis, chief economist at Bank of Baroda, described the trend as follows:
- Main drivers: Automobiles and electrical machinery
- Supporting segments: Rubber products, computers and electronics, and non-metallic machinery
- Weaker segments: Wearing apparel, chemicals and pharmaceuticals, where exports were affected by global disturbances
What Happened Within Power Generation?
| Source | September Growth | August Growth |
|---|---|---|
| Non-renewable electricity | 16.5% (30-month high) | Not specified |
| Renewable electricity | 4.3% | 15.4% |
How Did Use-Based Categories Move?
Five of the six categories grew more slowly than in August.
| Category | September | August |
|---|---|---|
| Capital goods | 10.4% | 15.9% |
| Intermediate goods | 12.2% | 14.2% |
| Primary goods | 4.0% | Not specified |
| Infrastructure goods | 7.2% | 8.0% |
| Consumer durables | 6.0% | 10.5% |
| Consumer non durables | 1.4% | Contracted |
Primary goods, which have the largest weight among these categories at 31%, grew at their slowest pace in four months. Consumer durables recorded their weakest growth in five months. Consumer non durables were the only category to improve, returning to growth after two months of decline.
How Does FY27 Compare So Far?
Manufacturing and electricity accounted for most of the stronger performance in the first half.
| Period | Average IIP Growth |
|---|---|
| April to June FY27 | 6.2% |
| July to September FY27 | 7.3% |
| First half FY27 | 6.8% |
| First half FY26 | 4.4% |
Final Outlook
ICRA expects GDP growth for July to September to be above 7.0%, down from 7.8% in April to June. The official estimate will show whether stronger industrial activity in the quarter carries into the wider economy. In the coming months, attention will be on whether mining output stabilises after a long contraction.


Explore Our Offerings

Stocks
Trade equities across NSE and BSE with zero delivery charges. Invest, hold or sell with a seamless experience.


Future & Options
Execute complex strategies with simple tools and real-time data.

IPOs
Apply to the latest IPOs in just a few taps. Stay updated and capture opportunities as they open.